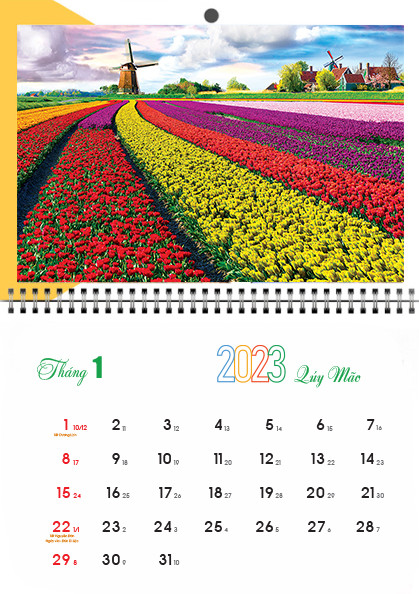
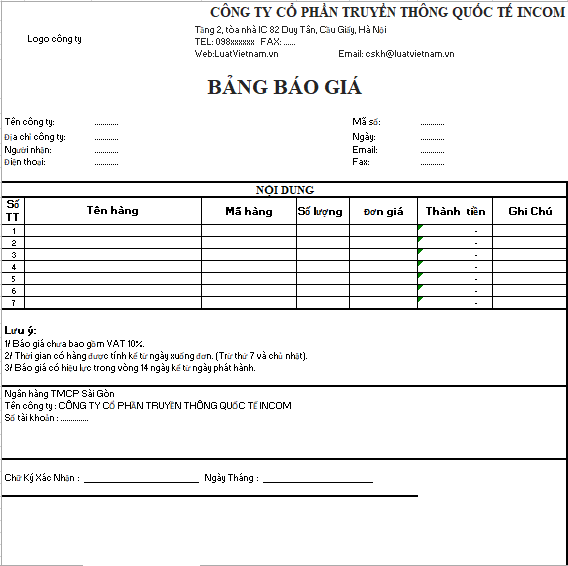
Price lists and charts are important tools for presenting data and pricing information. Price lists are often used to list products or services and their prices, while charts are often used to show trends or relationships between data.
What is the price list? and how to present data information
Price lists are often used in the retail, service and business sectors. Price lists can be used to provide information about the prices of products or services, as well as other information such as information about products, services, terms and conditions, etc.
Price lists can be designed in many different ways, but in general, price lists should include the following information:
Title: The title should clearly state the type of information displayed in the price list.
Product or service listing: This listing should include the name, description, and price of each product or service.
Price: Prices should be clearly listed and easy to read.
Other information: Other information may be included in the price list, such as information about products, services, terms and conditions, etc.
What types of charts are there?
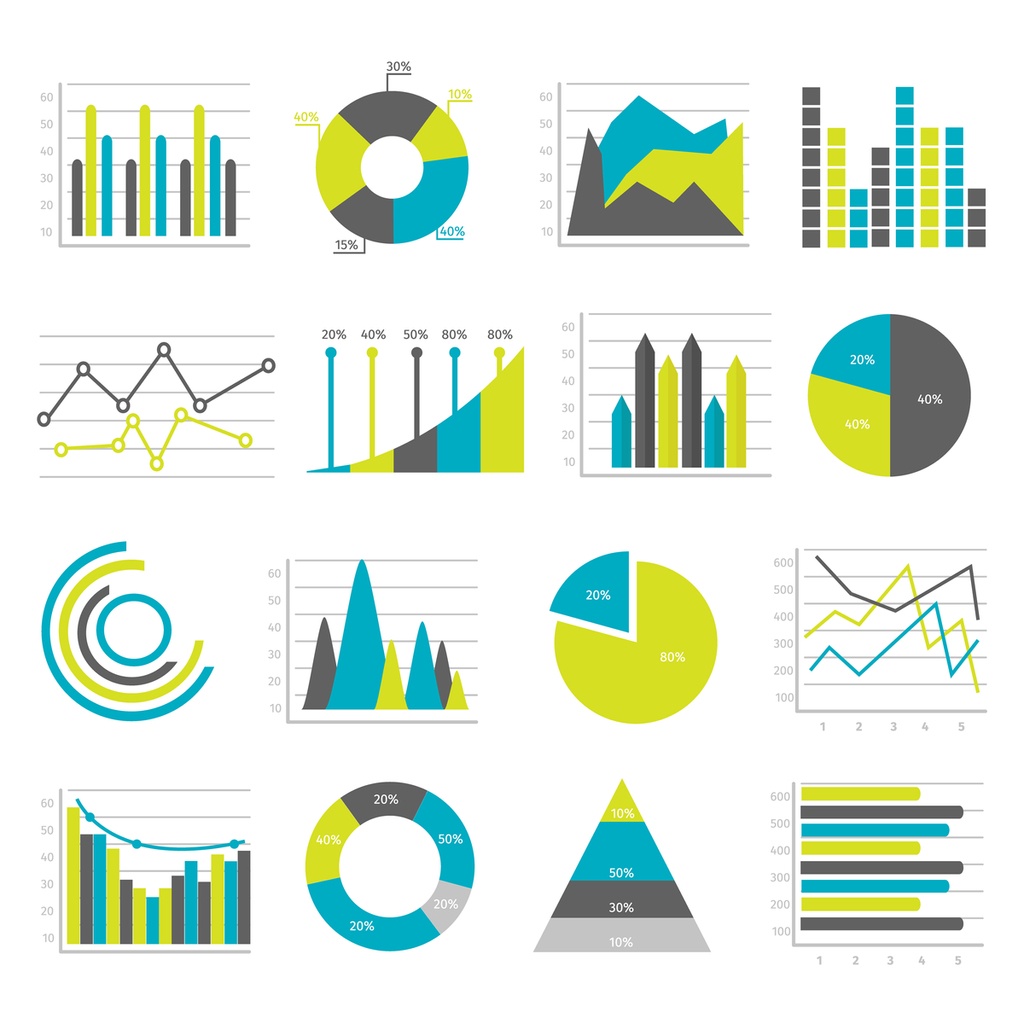
Charts are commonly used in the fields of business, finance, science, etc. Charts can be used to show trends or relationships between data.
There are many different types of charts, each of which can be used to display different types of data. Some popular chart types include:
Bar chart: Bar chart is used to display data in columns or bars.
Line chart: Line chart is used to display data in lines.
Pie chart: A pie chart is used to display data as sections of a circle.
When choosing which chart to use, you should consider the type of data you want to display and how you want to display that data.
Benefits of price lists and charts
Price tables and charts provide several benefits, including:
Present information clearly and easily: Price lists and charts can help present data and pricing information clearly and easily. This can help readers understand information quickly and easily.
Enhance understanding: Price tables and charts can help increase readers’ understanding of data and price information. This can help readers make more informed decisions.
Contribute to effective communication: Price lists and charts can contribute to effective communication. This can help you communicate your information more effectively to your target audience.
Note when using price lists and charts
When using price lists and charts, you should keep a few things in mind:
Accurate information: Price lists and charts must provide accurate information. This helps ensure that readers can trust the information you provide.
Easy to read: Price lists and charts should be easy to read. This helps readers understand information quickly and easily.
Aesthetics: Price lists and charts should be aesthetically pleasing. This helps attract the reader’s attention and makes the information easier to digest.
By using price lists and charts effectively, you can present data and pricing information in a clear, understandable and attractive way. This can help you achieve your business goals.
TAN VIEN PRINTING AND BUDDHIST CULTURAL PRODUCTS COMPANY LIMITED
Address: Căn 08, Dolphin Plaza, 28 Trần Bình, Mỹ Đình 2, Nam Từ Liêm, Hà Nội
Hotline: 0348.793.698 – 0825.727.265
Website: https://intanvien.com/
Fanpage: https://www.facebook.com/CT.VHP.PG.TanVien
Youtube: https://www.youtube.com/@CongTyTNHHVHPPhatGiaoTanVien


